Dr Matt Glanville is a keen track and road racing masters cyclist, a UCI world masters track champion in 2015, and current Australian record holder for the 2000m masters team pursuit. He also knows a thing or two about aerodynamics, being founding director of CPP’s Sydney Wind Tunnel facility established in 2007 and a committee member for Standards Australia wind loading code AS/NZS 1170.2:2021. A keen Bicycling Australia reader, here he shares some fascinating aero findings with fellow riders and enthusiasts.

Most competitive cyclists have at least a working knowledge of the training and dietary principles needed to reach their best performance. Be it interval training to increase VO2 max or dietary intake of carbohydrates versus proteins, there is literature and coaching guidance accessible to many. Most also appreciate the gains to be made through aerodynamic refinements however the science may appear inaccessible without access to a wind tunnel test facility.
No doubt aerodynamic gains can be purchased off the shelf in the form of disc wheels and tear drop tubing in streamlined bike frames. But the bicycle represents about one third of the total drag experienced by the cyclist; the remaining two thirds being drag on the human ‘bluff’ body themselves. Position on the bike is critical to reducing aerodynamic drag yet there is very limited guidance available to the recreational cyclist.
By grasping some key concepts in fluid mechanics however the cyclist can have a working knowledge sufficient to reduce their own aerodynamic drag. Furthermore, the improvements can be measured accurately without access to wind tunnels.
Wind Tunnel Testing
CPP has developed a test platform for wind tunnel testing of the cyclist whereby the rider can pedal at a cadence to mimic race conditions (Glanville 2020). The CPP wind tunnel contains a blockage tolerant roof section (Glanville 1997) which allows a cyclist to be tested in the moderately sized 3m x 2.4m test section.
Aerodynamic drag force Fd acting on a cyclist is represented by the equation below and is measured directly by a load cell typically over a range of wind tunnel velocities Vw (m/s).
Fd = 0.5CdAρVw2
A low air density ρ (kg/m3) is desirable to reduce drag force. Air density reduces with increasing altitude, reduced barometric pressure, increased temperature and humidity; however, these variables are outside the cyclist’s control unless they have the luxury of picking the time and place of competition.
The other two variables known to many cyclists are CdA, where Cd is the dimensionless drag coefficient and A is the frontal area (m2). Drag coefficient is always associated with a particular surface area and often paired together in terminology for convenience.
Reducing CdA
The benefit of reducing frontal area A is intuitive; the smaller the area we present to the wind the lower the drag.
Drag coefficient Cd has two basic contributors being skin friction and form drag. Form drag is the dominant contributor and relates to the shape of a body. A cyclist is considered a ‘bluff’ body in aerodynamic terms since form drag dominates and represents about 98% of the total drag (Underwood (2012)). So how can a cyclist minimise form drag?
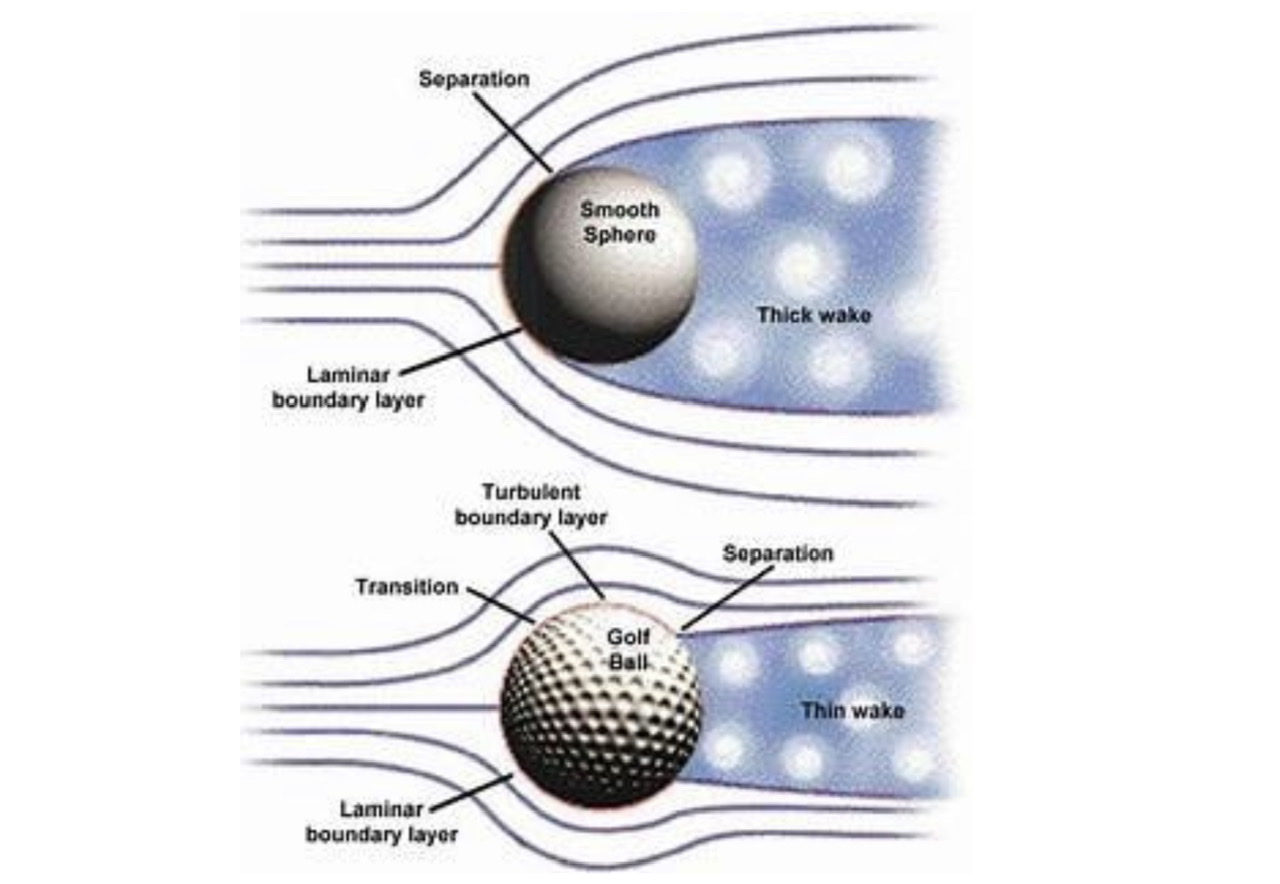
Let’s consider a stationary smooth sphere placed in a wind tunnel with air moving from left to right in Figure 2. The spherical shape is obviously different to the shape of a cyclist, but the aerodynamic principles associated with flow over a sphere are perhaps easier to conceptualise than flow over a human torso.
As moving air along the centre streamline approaches the centre of the windward face it starts slowing down as it can’t pass through the body. As the upstream air velocity decelerates it is converting velocity kinetic energy into a positive stagnation pressure felt against the windward face of the body.
It is intuitive that a decelerating flow will produce a positive stagnation pressure pushing against the body in this manner. Perhaps not as intuitive is that the opposite will occur, i.e., an accelerating flow will lead to a reduction in pressure felt against the surface (Google Bernoulli’s Principle to read more).
Outer flow streamlines in Figure 2 need to squeeze around the sphere and as they do they converge with adjacent streamlines and accelerate. There is an associated falling pressure associated with this air flow acceleration against the windward surface being a very low turbulent near laminar flow.
Air moving over the sphere cannot expand on the leeward side the same way it contracted on the windward side due to the low viscosity of air (note if a viscous medium such as honey instead of air were used then a near symmetrical flow pattern would occur over the sphere with near full pressure recovery on the leeward side).
Instead, a lower viscosity fluid such as air cannot decelerate at a sufficient rate to overcome the adverse pressure gradient associated with the expanding volume. Instead, a compensating localised reverse flow occurring near the surface trips the flow to break from the surface.
Turbulence
The air flow ‘separates’ at some point and the low viscosity air becomes highly turbulent in the wake formed. Once such a turbulent wake forms any hope of drag reducing pressure recovery is lost. Furthermore, the high suction pressures near point of separation on the top of the sphere tends to permeate the entire turbulent wake region so the leeward pressure can become highly negative over the entire leeward surface of the sphere.
The leeward suction pressure is additive to the frontal positive pressure and the net drag on the whole cylinder can increase dramatically. Hence reducing the size of our leeward wake is key to reducing the overall drag i.e., lowering total Cd value.
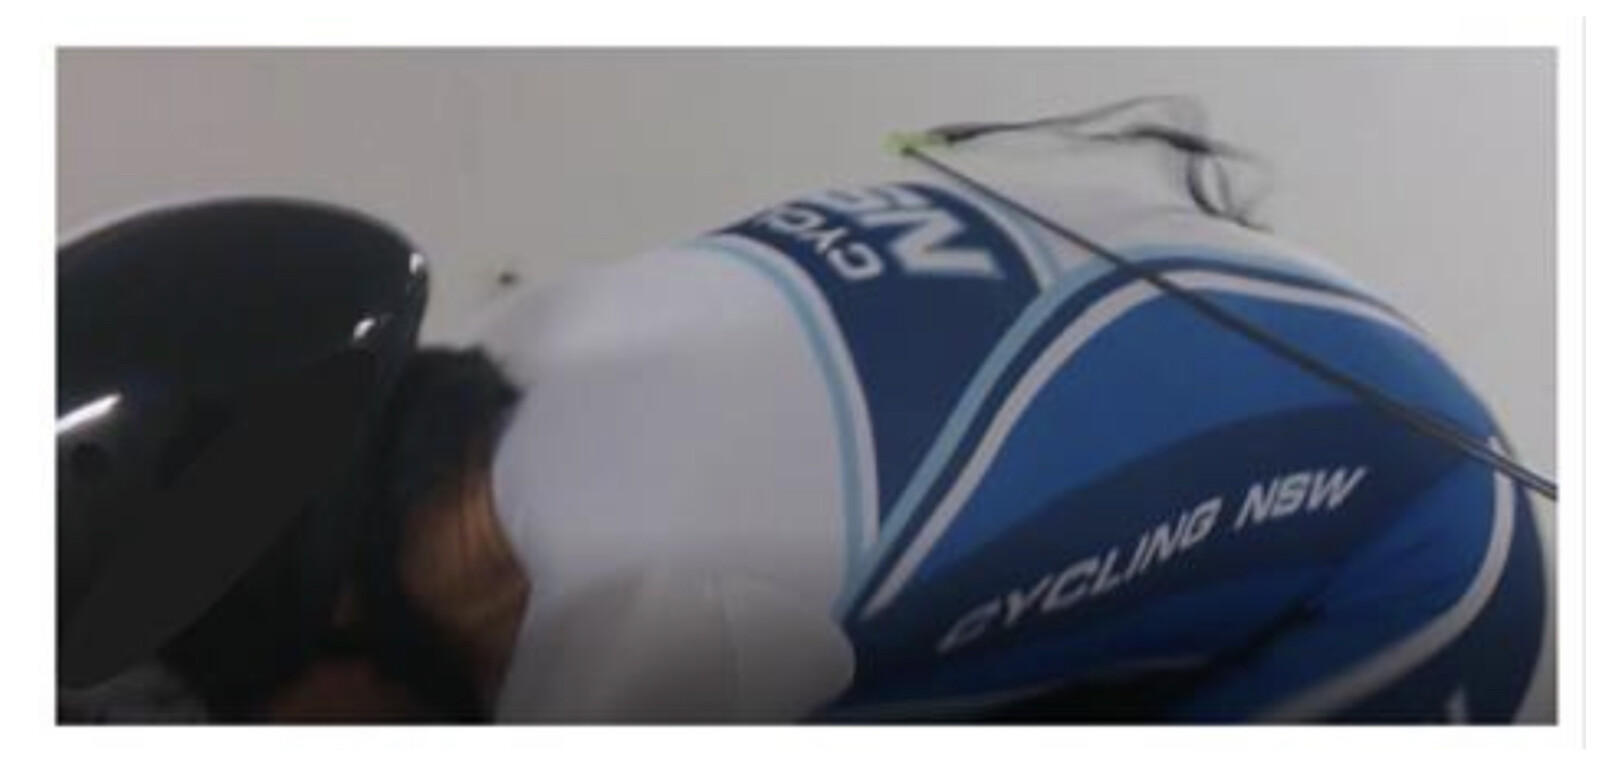
So how to reduce the wake volume? The point of flow separation is key. Where the physical geometry rapidly expands a detrimental flow separation point can occur. An example is the discontinuity formed by the back of a round helmet.
Wind separates from the rear of the helmet and can be seen as turbulence captured in the wind tunnel test below in Figure 3.
The turbulent wake flow is visualised by the flapping black tuft. Track pursuit cyclists are now adapting their posture to fill the gap between the rear of the helmet and the upper back in the currently popular praying mantis position. Those accomplished at holding the praying mantis position maintain near continuous curvature from their helmet, over their back to the lumbar to reduce flow separations.
Dimples In Clothing
For many years dimpled clothing has been known to reduce cyclists drag through the golf ball effect. With reference again to Figure 2, dimples can energise the boundary layer of air moving over a surface with turbulent energy to overcome leeward adverse pressure gradients. This pushes the point of separation leeward thereby reducing the wake volume. Some care is needed though as the same dimples can also increase frictional drag.
Dimples in clothing are best used judiciously in locations where there is potential for flow separation, for example on the shoulders and upper thoracic region.
Overall drag reduction through body positioning needs to reduce both Cd and A simultaneously. The tricky part is doing this whilst also maintaining an ergonomic position that maximises our physiological efficiency.
Pulling our elbows and shoulders in toward our chest in an aero tuck can reduce frontal area A but may compromise breathing and possibly drag coefficient Cd if a sharp local curvature is formed somewhere, e.g. at the shoulder blades.
There is a complex interaction between these variables which will vary between cyclists and still today the best way to minimise aerodynamic drag of the individual in practice is through empirical trial and error testing. But the wind tunnel is not the only option and the opportunity to quantify and optimise aerodynamic position is available to any cyclist with a power meter.
Power Meter Measurements
Measurement of power input exerted by the cyclist through the bicycle drive mechanism of given efficiency η can now be readily measured and logged using commercial power meters. Various authors including Simmons (2006) and Underwood (2012) describe a liner regression method to solve for CdA assuming a constant coefficient of rolling resistance Crr whereby:
𝜂 Pinput = 0.5CdAρVc3 + ΔKE/Δt + ΔPE/Δt + mgCrrVc
Conducting the regression method test during still conditions allows direct comparison between cycle velocity Vc and wind tunnel velocity Vw. The test cyclist and bicycle of weight mg needs to maintain near constant cycle power input and speed Vc to minimise any acceleration or deceleration, thereby tending ΔKE/Δt to zero. A cyclist on a flat road will minimise any elevational change also tending ΔPE/Δt to zero and thereby simplifying the equation.
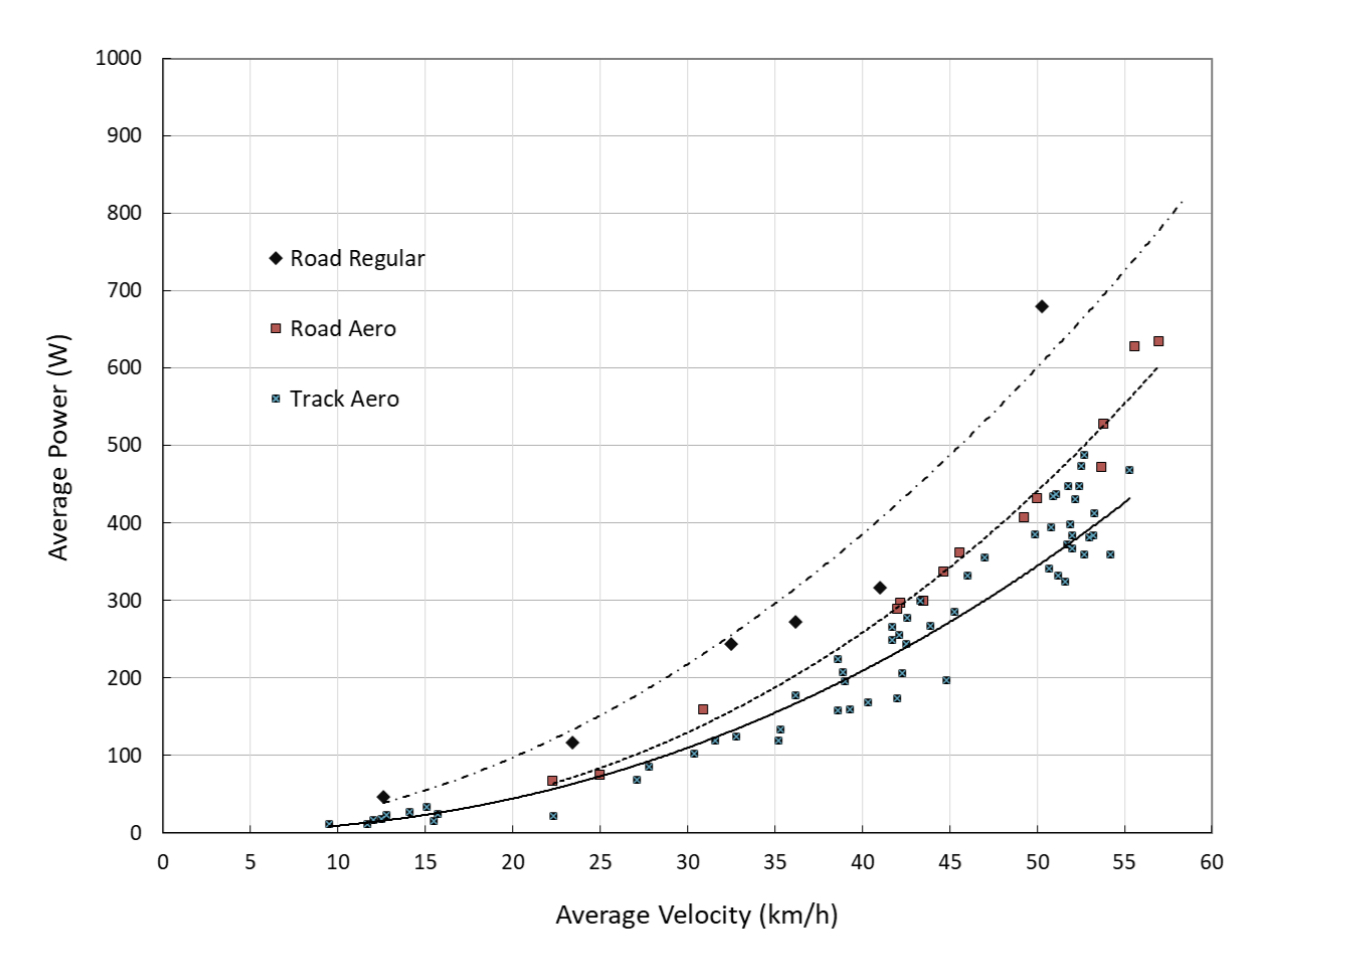
Power measured by the author’s power meter data measured at the Sydney Dunc Gray indoor velodrome and on flat roads during still atmospheric conditions are provided in Figure 4. Close agreement was also found with CdA values measured in the wind tunnel and at the velodrome using the same positions and bikes with correction for air density ρ during each test. A step-by-step guide to conducting the power meter test is provided below.
Step by step guide to measuring CdA
• Find a flat, straight, and smooth road surface on a calm day and away from traffic.
• Ride at constant velocity in a trial aero position whilst recording velocity and power.
• Repeat at a few different constant velocities, fast, medium and slow on the same stretch of road
and on the same day (or near identical conditions of atmospheric pressure, temperature and
humidity).
• Download data and clip any data accelerating to the target speed or slowing down after.
At this point a reference power vs velocity plot can be produced for the aero position, similar to Figure 4. Repeat test using various aero positions. Analyse and compare results; less power input required for the same velocity means reduced aerodynamic drag.
For the more technically motivated wanting to calculate the actual CdA number:
• Convert all data to SI units, e.g., divide km/hr by 3.6 to obtain speed in m/s
• Plot Velocity2 vs Force. Note Force = Power/Velocity
• Linear regression method solve CdA from slope and Crr from zero velocity intercept (rolling resistance is typically a small % of aerodynamic resistance at high velocity).
Correct for air density ρ noting the International Standard Atmosphere is 1.225 kg/m3. Drive chain efficiency η is usually taken as 95-98% efficient between 100-400W (Kyle 2003).
- Glanville, M.J and Gilet, L.F. (2020). Aerodynamic Drag Testing of Cyclists incorporating a Versatile Wind Tunnel Testing Platform, 4th Hong Kong Wind Engineering Society Workshop, The Hong Kong University of Science and Technology.
- Glanville, M.J. and Kwok, K.C.S. (1997). Further investigation of the blockage-tolerant wind tunnel technique, Journal of Wind Engineering and Industrial Aerodynamics 69-71, 987-995.
- Kyle, C.R. (2003). Selecting Cycling Equipment, Human Kinetics, 2 Edition, Ch1, 1–48.
- Simmons, A. (2006). Aerodynamic Drag Testing Using a Power Meter, www.wattmatters.blog,
April. - Underwood, L. (2012). Aerodynamics of Track Cycling. Ph.D. Thesis, University of Canterbury,
Department of Mechanical Engineering, Christchurch, New Zealand, June. - http://www.aerospaceweb.org/question/aerodynamics/q0215.shtml
With thanks to Dr. Matt Glanville – for further details you can email Matt via mglanville@cppwind.com or visit www.cppwind.com