 The past decade has been a fantastic time to be a cyclist as science and technology has catapulted the sport well and truly into the modern age. One of the most notable changes in the past 20 years has been the use of the power meter. Originally used more for testing athletes in the laboratory and monitoring and gauging fitness levels, it is now harder to actually find a bike in the peloton without a power meter.
This ability to measure power second by second in major races like the Tour Down Under is similar to seeing the speed, revs and gears being used in a formula one race car. It enables us to really get inside the race, to understand the actual demands being placed upon our favourite riders and best of all to give us an understanding of just where we would be sitting if the hammer went down on Willunga Hill.
To do this we must firstly have an understanding of what a watt really is and how it is the relation-ship between how many watts the rider produces and the weight of the rider when expressed as power to weight that ultimately decides the outcome for the GC riders at the TDU. It is also this power to weight relationship that would see us mere mortals out the back as soon as the road started to go upwards. Basically watts are derived from the calculation of measured torque at the cranks or the hub via a power meter multiplied by the angular velocity or cadence of the rider.
A very easy to understand analogy is considering the motor car engine and horse power, the higher the revs the faster the car goes. At low revs the car must produce a lot of torque to accelerate and if you put your foot down that acceleration is slow and laboured. At higher revs when you put your foot down the acceleration is quicker and lest torque is needed to propel the car forward. This relationship/ analogy is very similar to the different types of riders racing at the tour. There are the big diesels who produce lots of low cadence torque and can grind away in a relatively big gear to produce their power up a climb like Cadel Evans and there are riders like Chris Froome who can accelerate very quickly and attack explosively who spin up the climbs with very high cadences. Both will produce very similar power when related to body weight, but, do so in different ways, one like the turbo diesel or big V8 and the other like the highly tuned 2 ltr 16 valve turbo.)
A METER MATTERS
The actual power meters used are only a part of the picture of recording and tracking data however. Each power meter measures and sends data differently and very few riders or coaches understand that the accuracy of each device is often compromised by the head unit being used or the data sample rate the head unit is set to record or is able to record. This is where Today’s Plan has been working to develop a mobile head unit option that uncovers the very best of every power meter, from 4 – 8 times a second sample rates to independent right and left leg vector analysis to really delve deep into the mechanics of the pedal stroke and uncover what is really happening at the pedals of the best riders in the world.
We have then established that a watt is a combination of torque and revs and that the leading tour riders will produce watts differently, but, ultimately have similar power, but how much power does a leading tour rider produce and how does that relate to the average local club rider and how much of a difference would that make in terms of distance up a climb like Willunga Hill?
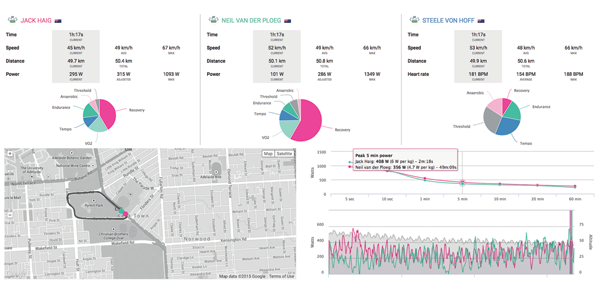
Working with World Tour riders, teams such as Avanti Racing and club riders looking to beat their mates up a local climb I have seen literally thousands of power files. Understanding and interpreting these files to help in training and racing is what separates the power user from the heart rate user when it comes to making huge forward steps with their training and racing. At the recent TDU using the Today’s Plan analytics system we were able to track the data of three of the UniSA riders, Jack Haig, Neil VDP and Steele Von Hoff. We had power meters on both Jack and Neil and heart rate on Steele. The interpretation of the data both during and after the race was very revealing to the everyday cyclist at every level.
Let’s look at the data from The People’s Choice Crit and Stage 3 and see what insights could help us all in understanding the real demands of different race situations and course types.