So you have taken the plunge and purchased a power meter – now, what the heck do you do with it? A very good question!
Having reviewed several different kinds of power meters across two issues and presenting the argument as to why any power meter is a good idea, in this final article I will cover some of the ways you can put the meter to good use.
Oodles of Data
It is entirely plausible to ride in the here-and-now with a basic bike computer or a heart rate monitor. As you ride along you observe values like speed, cadence, heart rate and time, but once you return home they are distant memories. If you are going to maximise your return from a power meter you have to get into the habit of saving your data somewhere and then analysing it after your ride (or find a coach to do it for you).
A typical power meter samples the data at 1 Hz (once per second) and has numerous data streams (speed, heart rate, cadence, altitude, temperature and of course power as a minimum). These are a lot of data to deal with from even a short ride. There are several online options for uploading your power files and delving into the analytic side. I think this is adequate for people getting started but to really take control of your power data you should consider software that resides on your home computer. The two that I have some experience with and are quite similar to each other are WKO+ which is licenced (there is a fee) and the Open Source alternative Golden Cheetah (free).
Consistency
You need to learn what your power output looks like now in order to understand how you want to alter it in the future. That means consistently recording and saving your power files for every ride during the first months. Many keen cyclists have a quiver of bikes and the power meter is probably installed on only one of them. Did you put it on your training bike, your race bike, the TT weapon or something else? As much as possible you should be riding with the power meter every ride (training and racing) while you build up your personal power profile.
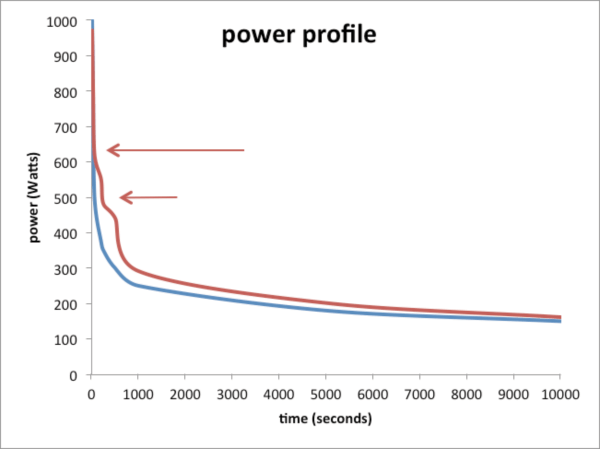
Power profiling involves determining what your maximum power output is for any given length of time. Look at the power profile graph on this page. The blue rider can put out around 1000 Watts for a few seconds. The power value drops off very quickly and levels out at around 150W beyond two hours (7200 seconds).
The red rider is very similar for short durations/high power outputs, but has a more powerful middle range before levelling out just above the blue rider for long durations. There are two ‘holes’ in the red profile, indicated by the two red arrows. These holes can be filled in by training to develop more power in the one- to four-minute range. It is also possible, and would be my first guess based on the shape of the line, that those holes are not real but a result of incomplete data gathering. This is why you want to record the power in every ride.
Fitness Test
To train with heart rate, a rider needs to establish training zones based on results from either a specific fitness test or from an appropriate racing situation. Perhaps you are familiar with the concept of these zones – E1 covers low heart rates for active recovery, E2 is next and covers low aerobic efforts right up to E5 which covers the very top of the range for maximal short-term efforts. The same process applies to training with power in that you need to determine your threshold power (FTP = functional threshold power) and then a series of power training zones.
At the most simple, the same factors govern power zones as heart rate zones. If you have a system you like when you move to power, you can keep using the same system in the realm of power. FTP is estimated through a fitness test. The rider does a 5km time trial at their fastest pace and takes the average power produced as the baseline (this is typically 104% of actual threshold).
Recovery rides are completed at less than 70% of this baseline power. Take a look at the data for our example cyclist. He produced 385W over the 5km TT, so his recovery threshold is 270W. Endurance rides live in the space between recovery and 88% of baseline (270-350 W). Predicted threshold is 370W. Confirming your true threshold requires a 60-minute maximal effort, such as you might produce in a longer time trial.
Power to Weight
If our example cyclist weighs 77kg, then he is producing 4.8W/kg (370/77) and should be quite competitive in open racing. If, on the other hand, he only weighs 63kg then he is producing 5.9W/kg., Former Festina coach Antoine Vayer argues that anything over 5.8W/kg is likely the result of performance enhancing drugs. More realistically he should probably weigh around 100kg at this power output, resulting in 3.7W/kg – a level that ought to see him quite competitive somewhere around B-grade in a club race.
Performance on a bicycle ultimately comes down to power to weight ratio. All the training is intended to increase the power portion. Pro cyclists are all extremely lean because they have reduced the weight portion as much as possible. If you want to go faster on your bike you have to alter one or the other – although for most club racers extra training tends to lead to both power increases and weight reductions so you get extra reward for your efforts.
Metabolic Pathways
There are three ways that our bodies power our muscles into action – these are the metabolic pathways.
First, the shortest and most powerful is the ATP-CP (Adenosine Tri-Phosphate-Creatine Phosphate) system. ATP is the fuel for all muscular contractions. Each muscle cell has a small amount ready to go. The muscle uses the energy contained in the molecular bond keeping that third phosphate attached, resulting in a free phosphate particle and adenosine di-phosphate (ADP). Creatine phosphate can quickly replenish the missing third phosphate to ADP, making it ATP again. Around 10 seconds of action and all of the phosphates are used up. Even in the Tour de France, a race lasting three weeks, the ATP-CP system is called into play regularly to power end of stage sprints, breakaways mid-stage and attacks in the mountains.
Second, of middle duration and middle power is the anaerobic glycolysis system. Glycogen is a sugar stored in a variety of places in the body and is distributed via the circulatory system, which provides chemical power to restore ADP and a loose phosphate to ATP. In the short term (up to around 44 seconds) the muscle cells can exploit the glycogen stored in each cell to power further contractions. The by-product of this is our old friend lactic acid. Any time your output exceeds your circulatory system’s ability to provide oxygen to the muscle cells, the lactate level will increase.
Finally we have the longest and slowest mode of activating muscles in aerobic glycolysis. Blood carries both glycogen and oxygen to the muscle cells where ATP can be restored and lactate can be further broken down (by the oxygen) in a highly sustainable process. It is oversimplifying things, but basically everything lasting over one minute is powered this way.
Training Specificity
If you want to increase your power in the short-term efforts it does little or no good to spend hours riding. Similarly if you want to increase your ability to ride fast for three hours it will not help (much) to complete 15-second sprint efforts.
I always interview new cyclists I am coaching to find out their perceived strengths and weaknesses. A power meter often reveals that their actual and perceived traits differ somewhat. Training by power allows you to train much smarter, filling in the holes in your power profile. You really do get out what you put in and a power meter makes quantifying these quite easy.
Table: Training power zones are based on average power over a 5km time trial effort.
|
Zone |
Lower |
Upper |
|
Recovery |
0% |
70% |
|
Endurance |
70% |
88% |
|
Threshold |
88% |
92% |
|
Anaerobic |
92% |
100% |
Warming Up
Many drills and all races require a proper warm up prior to the start. A procedure that works for many people involves starting at a moderate pace for 10 minutes. Then pick up the pace slightly for 15 minutes until power is slightly above your recovery limit. For 10 minutes continue to ramp up the effort by 10% (from 270 to 300W for our example cyclist). Using a small gear and a high cadence, pedal as fast as you can for 30 seconds. Return to the level you were using immediately before this effort for five more minutes. Repeat the 30-second effort. Take 10 minutes to gently get your power back into the recovery zone. Total time is 51 minutes.
Sprint Drill
To develop the ADP-CP system requires taxing it. Since it only lasts around 10 seconds, the efforts also are around 10 seconds each. In fact, for someone starting out on this drill for the first time I would recommend seven or eight seconds (it is very hard to be time accurate over this period anyway). For these drills, do not try to use a lap button on your computer as you’ll mess with the maximal effort level you are aiming at.
Complete a full warm-up. Use an appropriate gear so that your cadence at the end of the 10 seconds is just above your personal comfortable limit (for novices this might be under 100 rpm, for seasoned riders it could be over 170 rpm). Roll into the start with reasonable speed – mid 20 seconds will work – and then hammer with everything you’ve got for 10 seconds. Ride around in a small gear at a low cadence for five to 10 minutes. Get off your bike and sit down in the grass – even better if you can lie down and put your feet up – for 15 minutes. Get back on the bike taking a few minutes of pedalling to make sure all systems are ready to repeat. Continue to failure (in this case failure is when your average power for the 10 seconds is down by 10% on the first one). When finished, ride in the recovery zone for 20 to 30 minutes.
As you progress with this over the months, you can aim to stretch out the efforts to a maximum of 12 seconds. You can also aim to complete more repeats in the set, but I wouldn’t want to see anyone doing more than five because that is a good indication that they aren’t going hard enough. Initially you should be doing this with the wind behind you and on flat to slight downhill slope. To up the challenge after many months (or years) you can swap directions such that you are going up a gentle slope and into any prevailing wind.
Power Drill
Most road cyclists will see little benefit from the sprint drill. If you are a natural sprinter then maximising that ability makes a lot of sense. For the rest of us a longer interval will pay many more rewards. The one-minute interval is my favourite. One minute is long enough that it requires a solid aerobic input, but short enough that it taxes the anaerobic pathways as well.
A decent warm-up is important. These are best done on fairly flat terrain. Roll into the interval with good speed in the correct gear and begin. The mistake most people make is going too hard from the gun and having to back off. This will be obvious in the data file your power meter produces. Hold that power for one minute and relax. Ride for three minutes in an easy gear but keep those pedals turning. Continue to failure (measured as a 10% drop in average power). Have a short recovery ride after your last interval before getting off the bike.
You should be aiming to do somewhere between five and 10 of these per session. I have never seen anyone who could do more than 10 who was also doing them correctly. As you progress you can shorten the period between efforts. Drop the off period to two minutes, then one minute, then 30 seconds. Lab studies show that this drill has a positive effect on your performance long before the leg muscles gain anything out of doing it – it seems that your brain learns you are able to go harder than usual in training, so it permits you to go harder for longer in races.
Endurance Drill
This is a key exercise for most cyclists: track, road or mountain. The frequency of endurance riding you put in your program begins with lots at the beginning of the season decreasing as you get more racing time. Ride time is limited only by your personal schedule but should include one ride per week of roughly the same duration as your races last (if you regularly do three hour races there isn’t much to be gained from a six hour endurance ride, but if you plan on doing six hour race you better have put in some six hour sessions in the lead up if you want to go well).
After an abbreviated warm-up get your power up over the recovery limit and keep it between that and the endurance limit for the duration of the ride. If you are into bunch rides for your training, try to limit your unintended excursions above 88% (bunch sprints or hills, as examples) to less than one minute per hour of riding.
Time Trial Drill
The best TT riders can put out an average power for the event that actually exceeds their threshold power because of the way they meter out their power to maximise speed. If you are inexperienced at time trial, the best strategy you can adopt is to try to keep your current power and your average power the same for the whole event – smooth power delivery is nearly as fast as the more advanced power strategies. With practice you can learn to put out beyond-threshold power where it counts and recover where it doesn’t change your speed much.
This drill – called ‘cross-overs’ – helps you deal with sitting at threshold for longer periods of time and also with working beyond threshold for shorter periods of time. Your base heart rate is your FTP. Unless you have measured it in some direct way, use your most recent fitness test result multiplying the average power by 0.962 to estimate your FTP.
A two-minute period is a good starting point. Begin with a full warm-up. Gently bring your power level up to AT less 30W. Then start your timer and spend two minutes taking your power up 60W. After two minutes you ease off and spend two minutes letting the power decrease by 60W. Continue this to failure (the point at which you can no longer hold your power level where it should be).
You’ll see that you are actually running across your threshold (crossing over!) with a 30W window either side. If you are preparing for time trial competition, you want to be able to do this for as long as your TT will last. That may be around an hour for those doing a 40km event, and not much over 25 minutes for fast masters riders only doing 20km. Once you reach the desired duration, increase the length of the period slightly (2:30, 3:00, 3:30, 4:00). You can also increase the width of the window as you progress (40W either side, then 50W). Remember to adjust your FTP every time you retest your fitness level.
Tracking Fatigue
Hard rides make you tired while easy rides should leave you refreshed. With power you can quantify just how tiring each ride is. Almost all power meters and their native software, plus the two packages I mentioned above, use the same measures: NP, IF and TSS to name the main three. If you do nothing else with your power meter you can keep track of your accumulating fatigue and prevent yourself from overtraining.
NP is normalised power. It can be the same as average power up to significantly higher than average power. Average power is simply the mathematical mean of each power sample from the ride. Normalised power is adjusted to account for bigger efforts hidden within the average. A typical way to get the NP way up is to throw in some group sprints in an otherwise cruisy bunch ride.
IF is the intensity factor and is NP divided by FTP. Threshold power is critical to all of these measures, so if you lack a well measured value your tracking of fatigue will be wonky too. On a recovery ride the IF is below 0.7 while a track sprinter’s workout might push IF up above 1.5.
TSS is the training stress score. It accounts for how hard the ride was and also how long. By definition a ride of one hour with IF of 1.0 is a TSS of 100. Add the scores up for the week to quantify how hard your week was. Keep the scores under control and you should be fine – but first you need to discover by trial and error what weekly value works for you. A pro in a Grand Tour might well exceed 3000 while my commuting to work is not even 200.
Summing Up
Power is very useful. With a meter you can learn about the demands of the riding that you do, and then adjust your training to keep your strengths and address your weaknesses. Along the way it makes your training sessions more effective and it puts a real number on the difficulty of a ride, a week or a season. You, or your coach, just have to come to terms with the volume of data it produces. This article is really just the tip of the iceberg, there are numerous detailed books written solely about maximising your power meter based training plan. Most people that have a power meter only use a portion of the potential because of the difficulty in keeping on top of everything – which isn’t to say that they aren’t worth having. On the contrary, a power meter can be different things to different riders depending on what their needs are at the time. Power really is the state of the art right now.